Advanced Request Tracing debug interface
Enabling Advanced Request Tracing may pose a potential security risk. For this reason, we have implemented a mechanism to ensure secure communication from Cosmo Studio to your routers. This allows to debug routers in productionA connection with the controlplane is required and a router with version 0.42.3 or higher.
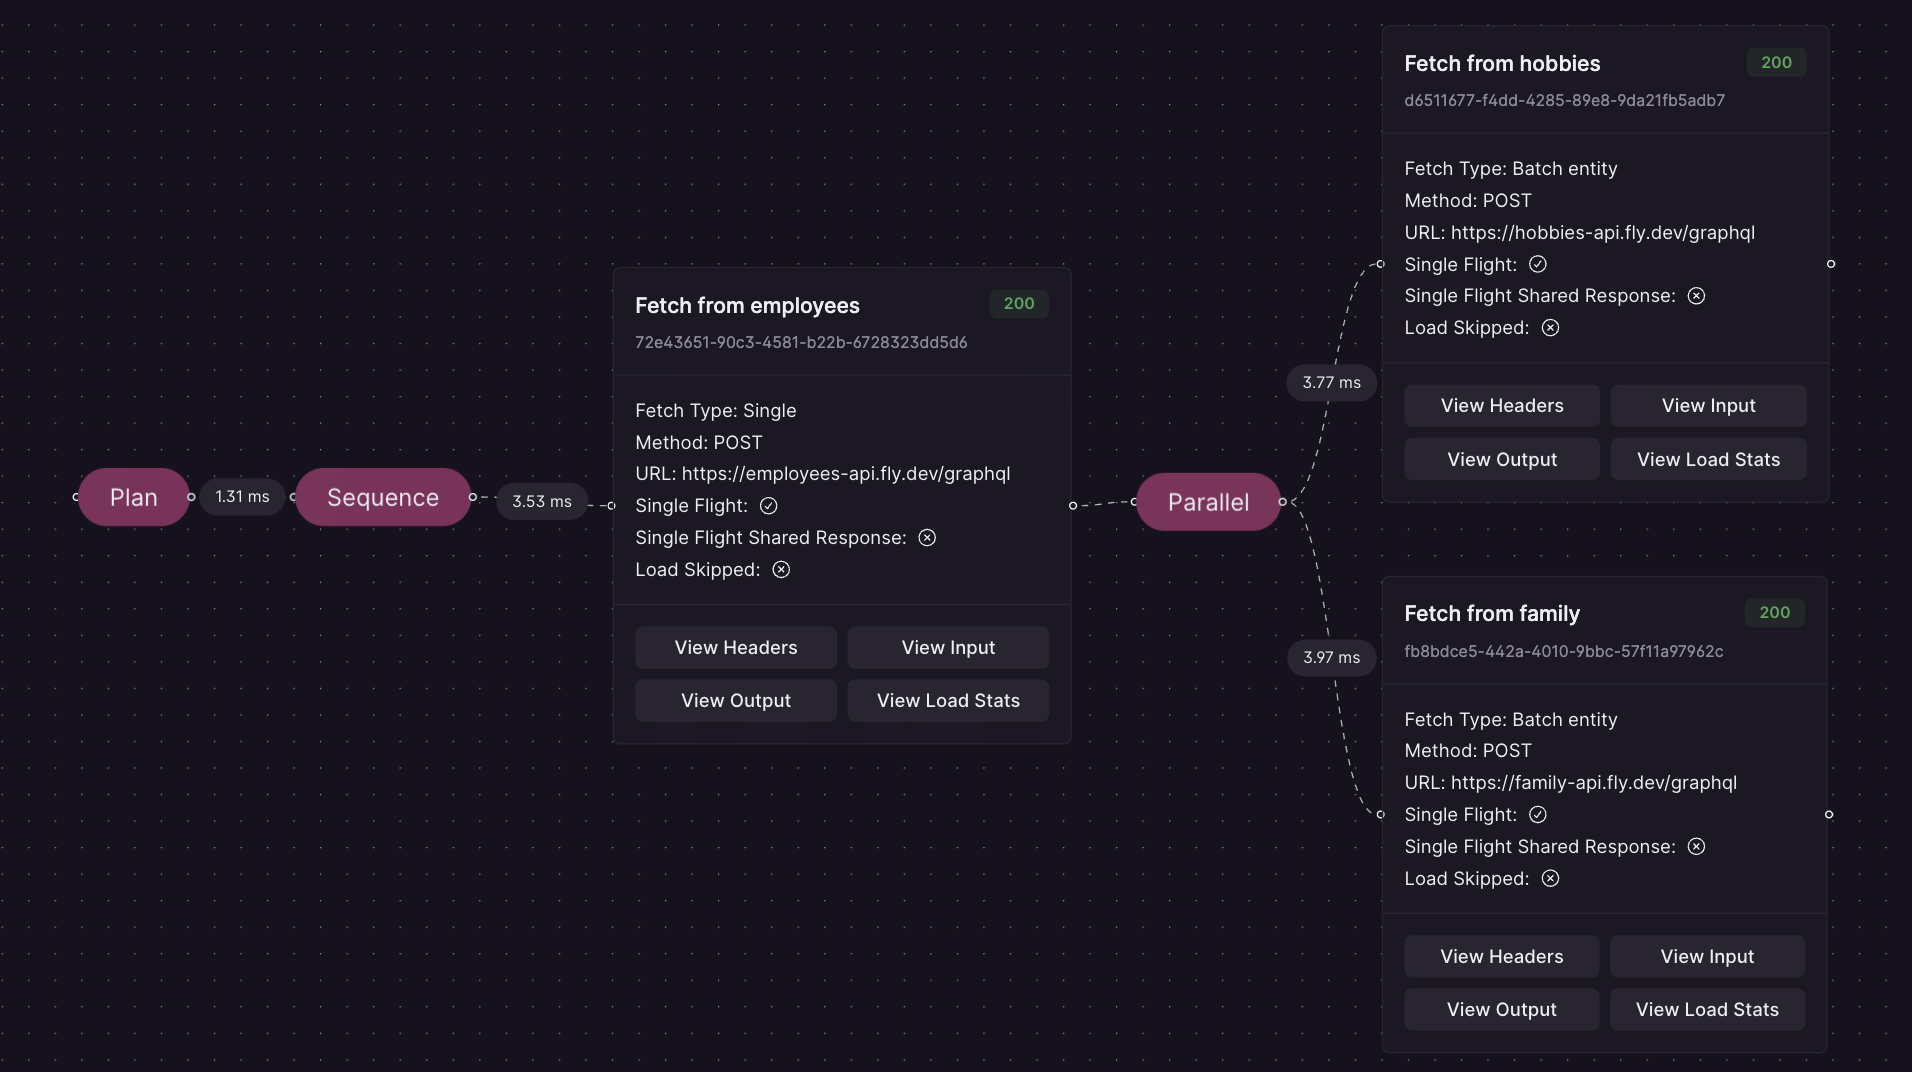
- planning timings, e.g. how long it took to generate an execution plan
- the general structure of the execution plan
- the types of fetches (load operations) the Router does, like parallel, serial, entity, batch entity, etc.
- what actual requests are being sent to the Subgraphs
- what data was used to render the input for a load operation
- the rendered input of a load operation
- the output of a load operation
- the timings, like latency, of a load operation
Configuration
For convenience, Advanced Request Tracing is enabled by default. When starting the Router, a warning indicates if the feature is active. To fully disable Advanced Request Tracing, set the following environment variable:Request Parameters
To use Advanced Request Tracing, you need to either use Request Headers or Query Parameters. To disable ART, simply omit the “X-WG-Trace” Header or the “wg_trace” Query Parameter.Headers
You must set the following Header to enable tracingQuery Parameter
It’s also possible to use Query ParametersOptional Arguments
Other (optional) arguments that are available:- exclude_planner_stats (exclude planner timings in the trace)
- exclude_raw_input_data (exclude the raw input data for a loader)
- exclude_input (exclude the rendered input data for a loader)
- exclude_output (exclude the output of a loader)
- exclude_load_stats (exclude load stats like latency)
- enable_predictable_debug_timings (useful for debugging, makes timings constant)
Examples
Enable Advanced Tracing but exclude planner stats and input via Header
Enable Advanced Tracing but exclude output via Query Parameters
Development
For security reasons, we don’t enable Advanced Request Tracing (ART) by default but you can enable it by setting the router environment variableDEV_MODE to true and using the following header in the playground: